Ejemplo de KMeans complejo
Aquí tenemos un buen ejemplo:
https://www.kaggle.com/code/heeraldedhia/kmeans-clustering-for-customer-data/notebook
El csv se puede descargar de aquí:
Aquí está el código:
# -*- coding: utf-8 -*-
"""KMeans Clustering for Customer Data
Automatically generated by Colab.
Original file is located at
https://colab.research.google.com/#fileId=https%3A//storage.googleapis.com/kaggle-colab-exported-notebooks/kmeans-clustering-for-customer-data-c2be81bf-5d74-4c8b-8e2a-e7d8edca97d2.ipynb%3FX-Goog-Algorithm%3DGOOG4-RSA-SHA256%26X-Goog-Credential%3Dgcp-kaggle-com%2540kaggle-161607.iam.gserviceaccount.com/20241030/auto/storage/goog4_request%26X-Goog-Date%3D20241030T100451Z%26X-Goog-Expires%3D259200%26X-Goog-SignedHeaders%3Dhost%26X-Goog-Signature%3D8829edb5a3a1e0f5ff607bd2e2164b8347d963ac2f9e58d9b5ac30e5134adad1779e43aa4723cb902a186864eab40aa0756c43beae4f25a73f31cc9958fe42fff1d71c29052cf53cf4eab87900c5e4f2eb574ac53e80f023bdaad29a130ff817f51a52b717d6839da78d59c07665a9e3b3e61b7b685a5d63b4b9dd738e5c64bc309400d7e63636dd4cb3fdb934262ced178514434c34e9f5380b787cba8f6a6d97d7c82c5ab12e9db0a72637b1678bbdbc6dca6eb8d79c5c41b302613f17f346bf3e8f4d4c9b80560fcb2abe649941e05a8f0ee82b5f08e1410381d8b3f9f867e208124376c139ef5a9a7a4b9bb046e1a32e4025f2f6d8b8722653d2cea083f5
"""
# IMPORTANT: RUN THIS CELL IN ORDER TO IMPORT YOUR KAGGLE DATA SOURCES,
# THEN FEEL FREE TO DELETE THIS CELL.
# NOTE: THIS NOTEBOOK ENVIRONMENT DIFFERS FROM KAGGLE'S PYTHON
# ENVIRONMENT SO THERE MAY BE MISSING LIBRARIES USED BY YOUR
# NOTEBOOK.
import kagglehub
vjchoudhary7_customer_segmentation_tutorial_in_python_path = kagglehub.dataset_download('vjchoudhary7/customer-segmentation-tutorial-in-python')
print('Data source import complete.')
"""## K Means Clustering for Customer Data
### Clustering
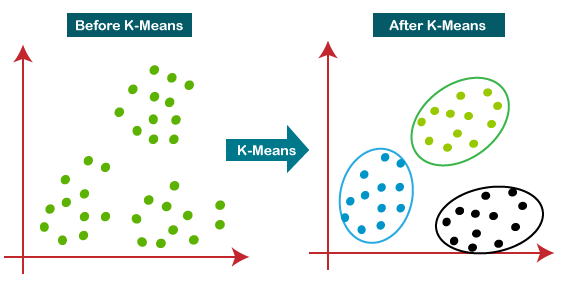
Clustering is the task of dividing the population or data points into a number of groups such that data points in the same groups are more similar to other data points in the same group than those in other groups. In simple words, the aim is to segregate groups with similar traits and assign them into clusters.
### KMeans Clustering
K-means clustering is one of the simplest and popular unsupervised machine learning algorithms. You’ll define a target number k, which refers to the number of centroids you need in the dataset. A centroid is the imaginary or real location representing the center of the cluster. Every data point is allocated to each of the clusters through reducing the in-cluster sum of squares. In other words, the K-means algorithm identifies k number of centroids, and then allocates every data point to the nearest cluster, while keeping the centroids as small as possible. The ‘means’ in the K-means refers to averaging of the data; that is, finding the centroid.
### About the dataset
This input file contains the basic information (ID, age, gender, income, spending score) about the customers of a mall. Spending Score is something you assign to the customer based on your defined parameters like customer behavior and purchasing data.
## K Means Clustering for Customer Data
"""
import numpy as np
import pandas as pd
import matplotlib.pyplot as plt
import seaborn as sns
import plotly as py
import plotly.graph_objs as go
from sklearn.cluster import KMeans
import warnings
warnings.filterwarnings('ignore')
"""## Data Exploration"""
df = pd.read_csv('Mall_Customers.csv')
print(df.head())
print(df.columns)
print(df.info())
print(df.describe())
"""### Checking for null values"""
print(df.isnull().sum())
plt.figure(1 , figsize = (15 , 6))
n = 0
for x in ['Age' , 'Annual Income (k$)' , 'Spending Score (1-100)']:
n += 1
plt.subplot(1 , 3 , n)
plt.subplots_adjust(hspace = 0.5 , wspace = 0.5)
sns.distplot(df[x] , bins = 15)
plt.title('Distplot of {}'.format(x))
plt.show()
sns.pairplot(df, vars = ['Spending Score (1-100)', 'Annual Income (k$)', 'Age'], hue = "Gender")
"""## 2D Clustering based on Age and Spending Score"""
plt.figure(1 , figsize = (15 , 7))
plt.title('Scatter plot of Age v/s Spending Score', fontsize = 20)
plt.xlabel('Age')
plt.ylabel('Spending Score')
plt.scatter( x = 'Age', y = 'Spending Score (1-100)', data = df, s = 100)
plt.show()
"""### Deciding K value"""
X1 = df[['Age' , 'Spending Score (1-100)']].iloc[: , :].values
inertia = []
for n in range(1 , 15):
algorithm = (KMeans(n_clusters = n ,init='k-means++', n_init = 10 ,max_iter=300,
tol=0.0001, random_state= 111 , algorithm='elkan') )
algorithm.fit(X1)
inertia.append(algorithm.inertia_)
plt.figure(1 , figsize = (15 ,6))
plt.plot(np.arange(1 , 15) , inertia , 'o')
plt.plot(np.arange(1 , 15) , inertia , '-' , alpha = 0.5)
plt.xlabel('Number of Clusters') , plt.ylabel('Inertia')
plt.show()
"""### Applying KMeans for k=4"""
algorithm = (KMeans(n_clusters = 4 ,init='k-means++', n_init = 10 ,max_iter=300,
tol=0.0001, random_state= 111 , algorithm='elkan') )
algorithm.fit(X1)
labels1 = algorithm.labels_
centroids1 = algorithm.cluster_centers_
h = 0.02
x_min, x_max = X1[:, 0].min() - 1, X1[:, 0].max() + 1
y_min, y_max = X1[:, 1].min() - 1, X1[:, 1].max() + 1
xx, yy = np.meshgrid(np.arange(x_min, x_max, h), np.arange(y_min, y_max, h))
Z = algorithm.predict(np.c_[xx.ravel(), yy.ravel()])
plt.figure(1 , figsize = (15 , 7) )
plt.clf()
Z = Z.reshape(xx.shape)
plt.imshow(Z , interpolation='nearest',
extent=(xx.min(), xx.max(), yy.min(), yy.max()),
cmap = plt.cm.Pastel2, aspect = 'auto', origin='lower')
plt.scatter( x = 'Age', y = 'Spending Score (1-100)', data = df, c = labels1, s = 100)
plt.scatter(x = centroids1[: , 0] , y = centroids1[: , 1] , s = 300 , c = 'red' , alpha = 0.5)
plt.ylabel('Spending Score (1-100)') , plt.xlabel('Age')
plt.show()
"""### Applying KMeans for k=5"""
algorithm = (KMeans(n_clusters = 5, init='k-means++', n_init = 10, max_iter=300,
tol=0.0001, random_state= 111 , algorithm='elkan'))
algorithm.fit(X1)
labels1 = algorithm.labels_
centroids1 = algorithm.cluster_centers_
h = 0.02
x_min, x_max = X1[:, 0].min() - 1, X1[:, 0].max() + 1
y_min, y_max = X1[:, 1].min() - 1, X1[:, 1].max() + 1
xx, yy = np.meshgrid(np.arange(x_min, x_max, h), np.arange(y_min, y_max, h))
Z = algorithm.predict(np.c_[xx.ravel(), yy.ravel()])
plt.figure(1 , figsize = (15 , 7) )
plt.clf()
Z = Z.reshape(xx.shape)
plt.imshow(Z , interpolation='nearest',
extent=(xx.min(), xx.max(), yy.min(), yy.max()),
cmap = plt.cm.Pastel2, aspect = 'auto', origin='lower')
plt.scatter( x = 'Age', y = 'Spending Score (1-100)', data = df, c = labels1, s = 100)
plt.scatter(x = centroids1[: , 0] , y = centroids1[: , 1] , s = 300 , c = 'red' , alpha = 0.5)
plt.ylabel('Spending Score (1-100)') , plt.xlabel('Age')
plt.show()
"""## 2D Clustering based on Annual Income and Spending Score"""
X2 = df[['Annual Income (k$)' , 'Spending Score (1-100)']].iloc[: , :].values
inertia = []
for n in range(1 , 11):
algorithm = (KMeans(n_clusters = n ,init='k-means++', n_init = 10 ,max_iter=300,
tol=0.0001, random_state= 111 , algorithm='elkan') )
algorithm.fit(X2)
inertia.append(algorithm.inertia_)
plt.figure(1 , figsize = (15 ,6))
plt.plot(np.arange(1 , 11) , inertia , 'o')
plt.plot(np.arange(1 , 11) , inertia , '-' , alpha = 0.5)
plt.xlabel('Number of Clusters') , plt.ylabel('Inertia')
plt.show()
algorithm = (KMeans(n_clusters = 5 ,init='k-means++', n_init = 10 ,max_iter=300,
tol=0.0001, random_state= 111 , algorithm='elkan') )
algorithm.fit(X2)
labels2 = algorithm.labels_
centroids2 = algorithm.cluster_centers_
h = 0.02
x_min, x_max = X2[:, 0].min() - 1, X2[:, 0].max() + 1
y_min, y_max = X2[:, 1].min() - 1, X2[:, 1].max() + 1
xx, yy = np.meshgrid(np.arange(x_min, x_max, h), np.arange(y_min, y_max, h))
Z2 = algorithm.predict(np.c_[xx.ravel(), yy.ravel()])
plt.figure(1 , figsize = (15 , 7) )
plt.clf()
Z2 = Z2.reshape(xx.shape)
plt.imshow(Z2 , interpolation='nearest',
extent=(xx.min(), xx.max(), yy.min(), yy.max()),
cmap = plt.cm.Pastel2, aspect = 'auto', origin='lower')
plt.scatter( x = 'Annual Income (k$)' ,y = 'Spending Score (1-100)' , data = df , c = labels2 ,
s = 100 )
plt.scatter(x = centroids2[: , 0] , y = centroids2[: , 1] , s = 300 , c = 'red' , alpha = 0.5)
plt.ylabel('Spending Score (1-100)') , plt.xlabel('Annual Income (k$)')
plt.show()
"""## 3D Clustering Age , Annual Income and Spending Score"""
X3 = df[['Age' , 'Annual Income (k$)' ,'Spending Score (1-100)']].iloc[: , :].values
inertia = []
for n in range(1 , 11):
algorithm = (KMeans(n_clusters = n, init='k-means++', n_init = 10, max_iter=300,
tol=0.0001, random_state= 111, algorithm='elkan'))
algorithm.fit(X3)
inertia.append(algorithm.inertia_)
plt.figure(1 , figsize = (15 ,6))
plt.plot(np.arange(1 , 11) , inertia , 'o')
plt.plot(np.arange(1 , 11) , inertia , '-' , alpha = 0.5)
plt.xlabel('Number of Clusters') , plt.ylabel('Inertia')
plt.show()
algorithm = (KMeans(n_clusters = 6 ,init='k-means++', n_init = 10 ,max_iter=300,
tol=0.0001, random_state= 111 , algorithm='elkan') )
algorithm.fit(X3)
labels3 = algorithm.labels_
centroids3 = algorithm.cluster_centers_
y_kmeans = algorithm.fit_predict(X3)
df['cluster'] = pd.DataFrame(y_kmeans)
df.head()
import plotly as py
import plotly.graph_objs as go
trace1 = go.Scatter3d(
x= df['Age'],
y= df['Spending Score (1-100)'],
z= df['Annual Income (k$)'],
mode='markers',
marker=dict(
color = df['cluster'],
size= 10,
line=dict(
color= df['cluster'],
width= 12
),
opacity=0.8
)
)
data = [trace1]
layout = go.Layout(
title= 'Clusters wrt Age, Income and Spending Scores',
scene = dict(
xaxis = dict(title = 'Age'),
yaxis = dict(title = 'Spending Score'),
zaxis = dict(title = 'Annual Income')
)
)
fig = go.Figure(data=data, layout=layout)
py.offline.plot(fig)
df.head()
df.to_csv("segmented_customers.csv", index = False)
"""### Final Note
Thus, we have analysed Customer data and performed 2D and 3D clustering using K Means Algorithm. This kind of cluster analysis helps design better customer acquisition strategies and helps in business growth. Let me know your feedback for this notebook, happy kaggling :)
"""